Calculadora de Pegada de Carbono da Dieta
Esta calculadora utiliza os dados de gases de efeito estufa da dieta de Scarborough et al. (2014), um estudo com 55.504 pessoas no Reino Unido que agrupou os participantes de acordo com o consumo medido de carne e modelou as emissões por 2.000 kcal de alimentos ingeridos. Escolha o grupo que melhor corresponde à sua alimentação para ver uma estimativa anual e compare-a com todos os outros grupos.
Resposta curta: Uma dieta rica em carne está associada a aproximadamente 2,6 toneladas de CO2-equivalente por ano provenientes da alimentação, contra cerca de 1,1 tonelada para uma dieta vegana — uma diferença de cerca de 60%.
2.05t CO₂e
A sua alimentação, por ano
1.05t CO₂e
Mesmo agregado, vegano
1.00t poupadas
Diferença anual
- Carne alta (100 g+ por dia)2.624
- Carne média (50–99 g por dia)2.055
- Carne baixa (menos de 50 g por dia)1.705
- Peixe, sem carne1.427
- Vegetariano1.391
- Vegano1.055
kg CO₂e por ano · Scarborough et al. 2014
Como calculamos
- As emissões diárias por grupo são retiradas de Scarborough et al. (2014), padronizadas para 2.000 kcal por dia.
- Os totais anuais são o valor diário multiplicado por 365.
- Os números abrangem as emissões de produção; cozimento, varejo e transporte pessoal até as lojas não estão incluídos.
- Os resultados individuais variam conforme os sistemas de produção locais, o desperdício de alimentos e as escolhas alimentares exatas.
Perguntas frequentes
- Quanto CO2 uma dieta vegana economiza por ano?
- Em comparação com uma dieta rica em carne (100 g ou mais de carne por dia), uma dieta vegana está associada a cerca de 1,5 tonelada a menos de CO2-equivalente por ano, com base em Scarborough et al. (2014).
- Uma dieta vegetariana é quase tão boa quanto uma vegana?
- É próxima, mas não igual. Uma dieta vegetariana fica em torno de 3,81 kg de CO2e por dia contra 2,89 kg para uma dieta vegana, porque laticínios e ovos ainda carregam emissões da pecuária.
- Comer local importa mais do que comer vegetais?
- Para a maioria dos alimentos, não. O transporte representa uma pequena parcela das emissões dos alimentos para a maioria dos produtos, enquanto o que você come geralmente domina o total.
Fontes
Mais ferramentas
Um ponto de partida útil · tools
Entenda o quadro completo
Bom jornalismo ambiental ajuda a orientar, verificar uma afirmação e escolher o próximo passo. Reunimos evidências, contexto e caminhos práticos sem reduzir temas complexos a slogans.
Evidência
Baseado em pesquisa
Contexto
Conectado
Próximo passo
Prático
Como usar esta seção
| Comece por | Você encontra | Ideal para |
|---|---|---|
| The overview | A clear answer and the essential terms | First-time readers |
| The evidence | Sources, comparisons and reported context | Checking a claim |
| The pathways | Related topics, tools and further reading | Going deeper |
Perguntas frequentes
Is this information opinion or reporting?
We separate evidence, interpretation and practical guidance. Claims should be traceable to research, public records or clearly identified editorial analysis.
Can one choice solve these problems?
No. Food systems, animal welfare and climate are connected systems. Individual choices matter, and so do policy, business and collective action.
Where should I continue?
Use the related topics, topic hubs and calculators on this page to move from a quick answer to the primary context behind it.
Contexto aprofundado
As evidências por trás do sistema alimentar
Animal agriculture sits at the intersection of climate, land use, water, public health and animal welfare. These reference points recur across our reporting, so we keep them in one place: the numbers most often cited, the way we read a claim, the myths that survive longest, and the vocabulary you need to follow the debate in any language.
Pontos de referência
- ~80 billion
- land animals farmed and slaughtered each year worldwide
- ~14.5%
- share of global greenhouse gas emissions linked to livestock supply chains
- ~77%
- of agricultural land used for grazing and feed production
- ~70%
- of freshwater withdrawals worldwide go to agriculture
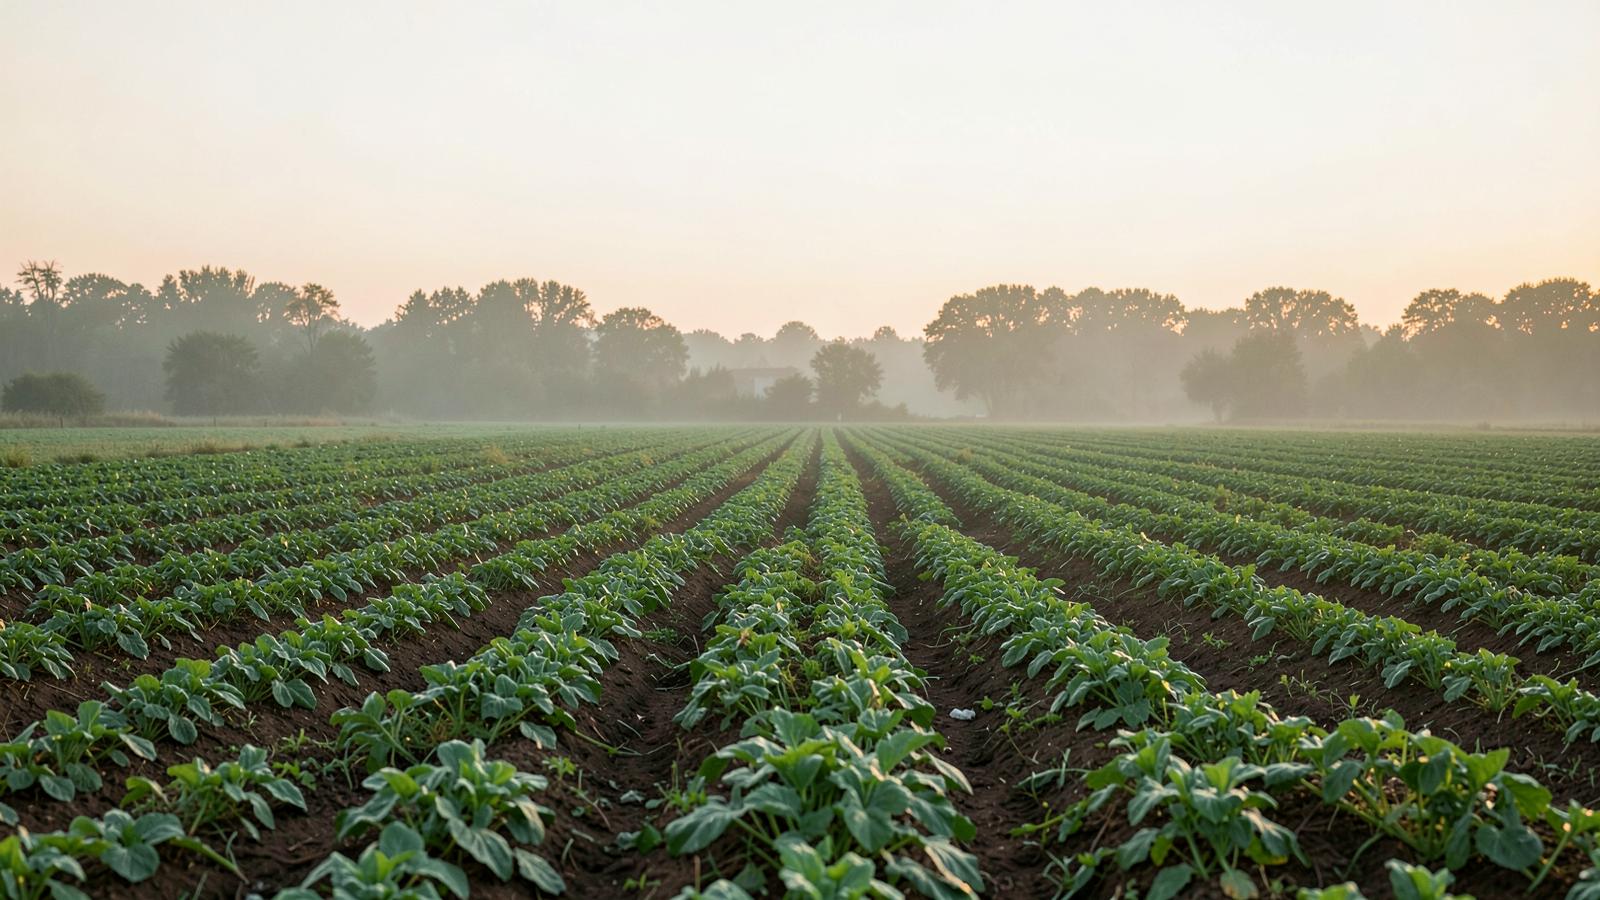
A terra é o ponto de virada
Roughly three quarters of global farmland is used for livestock, yet it supplies a minority of the world's calories. Shifting even part of that land back to crops, forest or wetland is the single largest lever most countries hold.
Como ler uma afirmação em cinco passos
- 01Find the original sourceTrace the figure back to a study, dataset or public record rather than a headline restating it.
- 02Check the boundaryAsk what the number counts: farm gate only, or land use, feed, transport and processing too.
- 03Compare like with likePer kilogram, per gram of protein and per calorie can point in different directions.
- 04Look for the rangeCredible estimates come with uncertainty; a single precise-sounding figure often hides it.
- 05Ask who is affectedAnimals, workers, neighbouring communities and future readers all carry part of the cost.
Mito e evidência
| Afirmação comum | O que mostram os dados | Por que importa |
|---|---|---|
| Local food is always the lowest-carbon choice | Transport is a small share of most food footprints; what is produced matters more than how far it travelled. | It redirects effort towards the choices with real leverage. |
| Plant-based eating cannot meet protein needs | Legumes, grains, soy foods, nuts and seeds cover protein and amino-acid needs in well-planned diets at every life stage. | Nutrition myths keep people from a change they were open to. |
| Higher-welfare labels mean animals are not harmed | Label standards vary widely and many permit routine practices readers would not expect. | Informed choices depend on knowing what a label actually certifies. |
| Individual choices are irrelevant next to policy | Demand shifts change what is produced, funded and legislated; the two move together. | It replaces fatalism with something you can act on this week. |
Vocabulário do debate
- Factory farming
- Intensive confinement systems that maximise output per animal and per unit of space.
- Life-cycle assessment
- A method that totals environmental impact across every stage of a product's life.
- Sentience
- The capacity to feel, perceive and experience — the basis of most animal-welfare law.
- Land-use change
- Conversion of forest, grassland or wetland into farmland, and the emissions it releases.
- Food-system resilience
- How well supply survives drought, disease and price shocks.
- Just transition
- Policy that protects farmers and workers while production shifts.
Da evidência às escolhas do dia a dia
Como isso aparece no prato
Numbers describe the system; meals, votes and purchases are how most people meet it. This field guide turns the reporting into concrete swaps, a four-week plan and the signals worth watching, so a page of research becomes something you can act on this week without pretending the hard parts are simple.
Trocas com maior efeito medido
| Em vez de | Experimente | Por que importa |
|---|---|---|
| Beef mince | Lentils, beans or soy mince | Beef carries by far the highest emissions and land use per gram of protein. |
| Dairy milk | Soy or pea milk | Comparable protein with a fraction of the land, water and emissions. |
| Cheese in daily meals | Nut or seed-based spreads, cashew cheese | Cheese is the most resource-intensive dairy product per kilogram. |
| Chicken and eggs | Tofu, tempeh, chickpeas | Removes the welfare cost of the most intensively farmed animals. |
| Farmed shrimp and salmon | Beans, jackfruit, seaweed-seasoned dishes | Avoids mangrove loss, bycatch and wild fish used as feed. |
| Butter | Olive or rapeseed oil | Lower emissions per kilogram and better cardiovascular profile. |
Um plano de quatro semanas que costuma durar
Most people who change their diet permanently do it gradually, one meal slot at a time, keeping the food they already like at the centre.
- 01Week 1 — breakfastChange the meal with the fewest variables: swap milk, add fruit, keep everything else identical.
- 02Week 2 — three dinnersCook three plant-based dinners you already know how to make well, rather than new recipes.
- 03Week 3 — restockRebuild the cupboard around pulses, grains, tinned tomatoes, nuts and frozen vegetables.
- 04Week 4 — eating outFind two reliable options near work or home, so social meals never become the failure point.
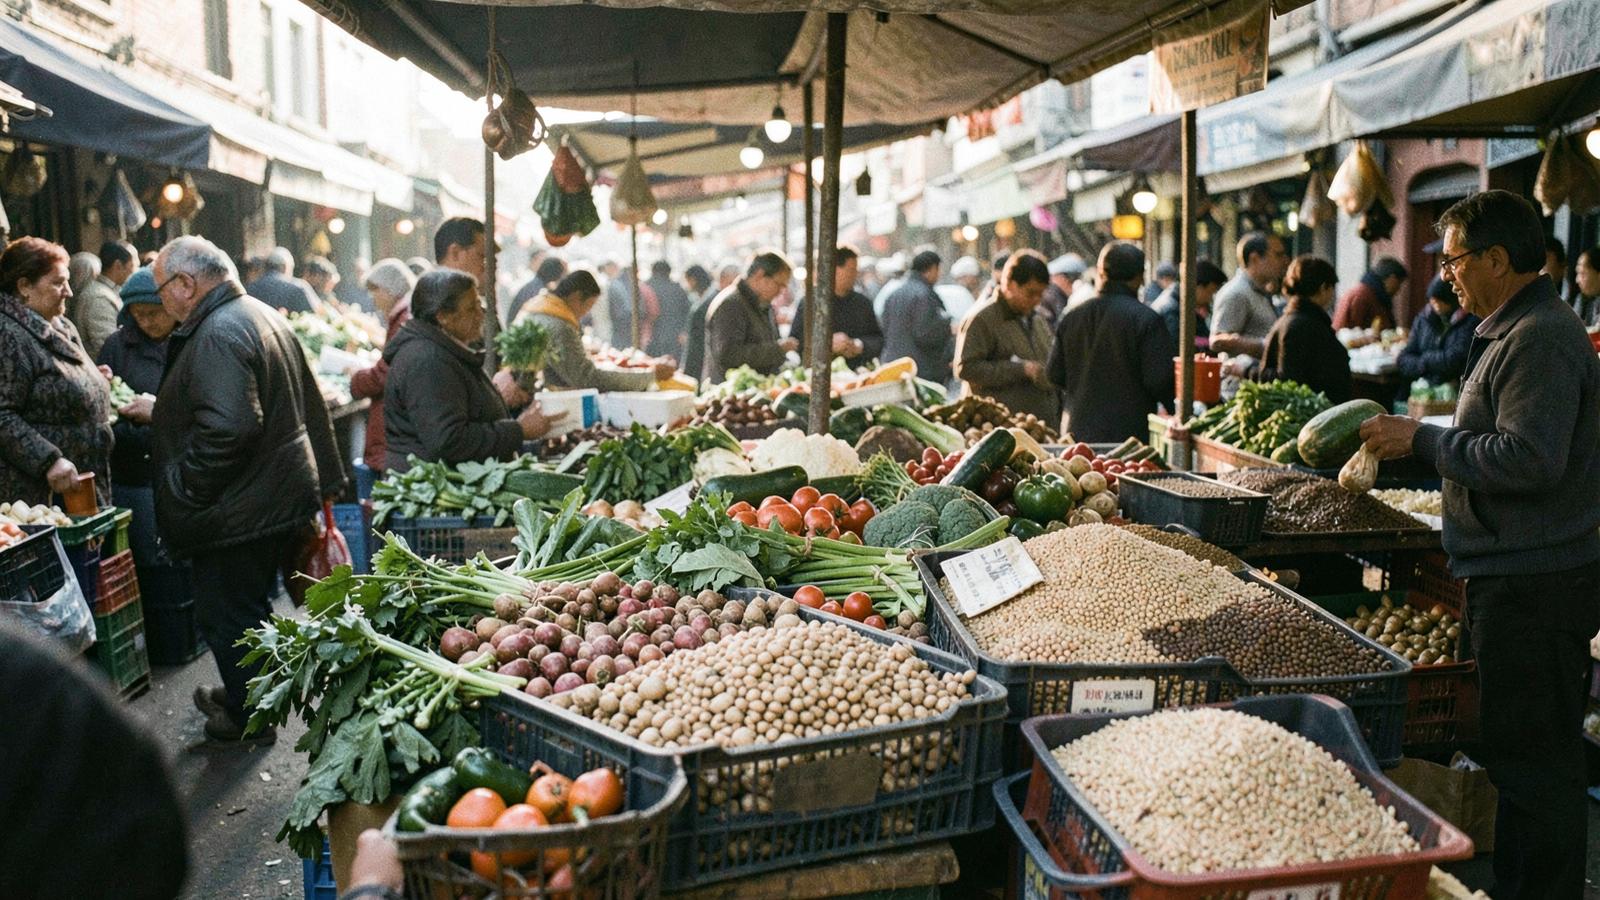
Onde a mudança fica visível
Markets are the clearest place to watch demand shift: as pulses, grains and vegetables take more shelf space, producers, buyers and policy follow the money rather than the argument.
Sinais a acompanhar
- Retail shelf shareHow much space plant-based products hold is a better indicator than launch announcements.
- Cage and crate bansLegislation on confinement moves faster than diet change and affects billions of animals.
- Feed-crop areaLand planted for animal feed shows whether production is actually shifting.
- Institutional menusSchools, hospitals and canteens change the default meal for millions at once.
- Price parityWhen plant-based costs the same or less, adoption stops depending on conviction.
- Transparency rulesLabelling and inspection records determine what the public can even see.
Perguntas práticas
- Do I have to change everything at once?
- No. Reducing the most resource-intensive foods most often — beef, cheese and farmed fish — produces most of the measurable effect, and partial changes maintained for years outperform strict changes abandoned in a month.
- Is plant-based eating more expensive?
- Staples such as lentils, beans, rice, oats, seasonal vegetables and tofu are among the cheapest sources of protein and calories. Cost rises mainly with processed meat substitutes, which are optional.
- What about nutrients like B12, iron and omega-3?
- A B12 supplement is standard advice for anyone eating mostly or entirely plant-based. Iron comes from legumes, tofu and greens, absorbed better with vitamin C; omega-3 from flax, walnuts, chia or an algae supplement.
- Does any of this reach the animals themselves?
- Demand determines how many animals are bred, and legislation determines how they are kept. Reporting tracks both because neither works alone.
Como o sistema funciona de verdade
Um mapa do sistema alimentar que cobrimos
Most coverage of animals, diets and climate arrives as isolated stories: a slaughterhouse investigation, a methane figure, a supermarket launch. They belong to one system with a small number of decision points. This map sets out that system stage by stage — who owns each step, where animals enter it, what the public can see, and which levers have historically moved it — so every article on this site can be read in context rather than as an isolated shock.
Etapa a etapa, do campo ao prato
Animal agriculture is a chain of separate businesses. Pressure applied at one link rarely stays there; it moves upstream to feed and land, or downstream to retail and price.
| Etapa | O que acontece | Onde está a alavanca |
|---|---|---|
| Land and feed | Soy, maize and grass are grown to feed animals, using roughly three quarters of agricultural land worldwide. | Deforestation rules, feed-import standards, and any fall in demand for animal products. |
| Breeding | Genetics companies supply fast-growing birds and high-yield dairy lines used across most of the industry. | Growth-rate standards; welfare commitments that specify breed, not just space. |
| Rearing | Animals are housed at density, typically indoors, with confinement systems that vary by species and country. | Cage, crate and stocking-density law — the fastest-moving area of animal legislation. |
| Transport and slaughter | Live animals move to centralised plants; a small number of companies process most of the volume. | Journey-time limits, CCTV and inspection rules, stunning requirements. |
| Processing and brands | Meat and dairy become branded products, with margins concentrated in processing rather than farming. | Labelling law, marketing claims, and corporate sourcing commitments. |
| Retail and food service | Supermarkets, canteens and restaurants set the default meal for most people most days. | Shelf share, menu defaults, procurement contracts and price parity. |
| The plate | Households choose within the range and prices the previous stages allow. | Repeat purchases, which retailers track far more closely than surveys. |
Quem decide de facto
Individual choices matter, but they are amplified or blunted by a handful of institutions that set defaults for millions of meals at a time.
- Supermarket buyersA handful of buyers decide what fills the shelves of an entire country, and their sourcing standards travel back up the chain to farms.
- Public procurementSchools, hospitals, prisons and armed forces buy meals in bulk; changing the default menu shifts millions of meals without asking anyone to change their mind.
- Regulators and inspectorsWhat can be documented determines what can be enforced. Inspection frequency and CCTV rules decide whether standards exist on paper or in practice.
- Subsidy designAgricultural support still flows mainly to animal products and feed crops, keeping prices below what the resource use would otherwise imply.
- Investors and lendersFinancing terms for new sheds, expansions and processing capacity set the size of the industry a decade ahead.
- Courts and citizen initiativesReferenda, lawsuits and ballot measures have repeatedly delivered confinement bans that legislatures would not pass on their own.
A terra é a variável silenciosa
Most farmland on earth feeds animals rather than people directly. That single fact explains why diet, deforestation, wildlife loss and climate keep turning up in the same story.
O mesmo sistema, pontos de pressão diferentes
| Região | O que determina os resultados |
|---|---|
| European Union | Confinement law and labelling lead globally; the unresolved question is imported animal products produced to lower standards. |
| United States | State ballot measures drive welfare change while federal rules lag; litigation over interstate sales is the recurring battleground. |
| Brazil and South America | Feed-crop expansion and cattle ranching sit at the interface with forest loss, making land use the decisive issue. |
| China and East Asia | Rapid growth in intensive production alongside fast-growing plant-based and cultivated protein investment. |
| India and South Asia | The world's largest dairy sector, where welfare questions centre on cattle, transport and the fate of male calves. |
| Sub-Saharan Africa | Smallholder systems dominate today; whether intensive models are imported is still an open decision. |
O que já mudou
Change in this system is slow, then sudden. These are the shifts that repeat across countries once they start.
- 01Battery cagesBans moved from single countries to whole blocs, then to corporate commitments covering supply chains beyond the law.
- 02Sow stalls and veal cratesRestricted in a growing list of jurisdictions once footage made routine confinement visible to voters.
- 03Plant-based milkMoved from specialty shelf to standard option in cafés and supermarkets within roughly a decade.
- 04Slaughterhouse CCTVIntroduced after undercover footage, converting sporadic scandal into continuous documentation.
- 05Deforestation-linked feedImport rules now require supply-chain evidence, tying European diets to land use elsewhere.
- 06Institutional menusCities and universities adopting plant-based defaults have produced the largest single-decision emissions cuts in catering.
Como ler uma afirmação sobre pecuária ou dietas
Most disputes come down to a handful of recurring tricks. Running a claim through these questions resolves the majority of them.
- Per what?Impacts per kilogram, per gram of protein and per calorie tell different stories. Ask which one is being used and why.
- Whose average?A best-case farm is not a national average, and a national average is not the global one behind imported products.
- Who funded it?Industry-funded studies are not automatically wrong, but disclosure changes how much weight a single result deserves.
- Legal or actual?A practice being legal says nothing about how common it is; enforcement records are the better source.
- Is the comparison fair?Comparing a processed substitute to a raw ingredient, or a farm to a factory, usually smuggles in the conclusion.
- What would change your mind?Claims that no evidence could falsify are advocacy, from any direction, and should be read as such.
Perguntas sobre o sistema
- Is factory farming the exception or the norm?
- It is the norm. The large majority of farmed land animals worldwide are raised in intensive systems; extensive and pasture-based farming accounts for a small share of total production, even where it dominates the imagery used to sell it.
- Why does land use matter so much?
- Around three quarters of agricultural land supports animal products that supply a minority of global calories and protein. Land is therefore the link between diets, deforestation, wildlife decline and climate targets.
- Do welfare reforms slow down bigger change?
- The evidence does not support that trade-off. Jurisdictions that banned confinement systems have generally also seen the fastest growth in plant-based alternatives, because both follow the same shift in public attention.
- Can individual choices matter in a system this large?
- Individually they are small; in aggregate they are the demand signal every other stage responds to. The measurable effects come from sustained changes across many people, and from the institutions that set default meals.
- Where does this newsroom get its figures?
- From peer-reviewed research, government inspection and production data, and named organisations. Where estimates are contested, articles say so and give the range rather than the most striking number.